Sources: OTA partner documentation, SEC filings, published industry research (Phocuswright, D-EDGE, Cloudbeds, SiteMinder, VIDEC, HOTREC-style association surveys) and OTALift production aggregates. Last reviewed: {{last_reviewed}}.
Key takeaways
Hotel distribution channels by region do not line up the way global advice assumes. In the US, online hotel bookings split almost evenly: 52% through OTAs, 48% through hotel websites and apps1. In Asia-Pacific, one vendor panel puts OTAs at around 83% of bookings, with Agoda now ahead of Booking.com2. In Saudi Arabia, Booking.com carries about 60% of OTA booking value3.
Our own rows: Expedia is 35.6% of Booking.com plus Expedia reviews across 33 US properties, and 1.5% across nine Ukrainian ones4. In the other regions this article covers we hold almost nothing: zero properties in Canada, Latin America, the Middle East, China, Japan, Korea or Southeast Asia, and one each in India and Australia. This is mostly external research, and every number carries its confidence.
What to do: read your own extranet's source mix before any global list, and give a regional leader its own line in your channel plan. Where nobody publishes a share (Japan, Korea, India, most of Latin America), the article says so. The fix steps are below.
Key numbers
- US online hotel bookings split 52% OTA to 48% hotel websites and apps in 2025, and Phocuswright expects that to hold through 20291.
- Independent hotels in North America got 52.7% of bookings from OTAs in 2025, up 3.3 points, in Cloudbeds' customer base5.
- OTAs account for around 83% of Asia-Pacific bookings in D-EDGE's panel, and Agoda rose from 16.4% in 2022 to 20.9% in 20252.
- Saudi Arabia's OTAs booked about $2.3bn of hotel value in 2024, Booking.com first with about 60%3.
- Brazilian hotel chains in the FOHB survey took 45% of sales direct and 55% indirect in 2024, OTAs 25% of the total6.
Why hotel distribution channels by region decide where your effort goes
A distribution channel is any route a booking reaches your hotel: OTAs, your website, phone, GDS, bed banks and wholesalers. Two hotels with the same rooms and the same ADR can have opposite channel problems. A Cancun boutique that ignores Expedia loses a leader. A Bangkok guesthouse that treats Expedia as the main event funds the fourth-ranked channel. The mix is local, and most advice is written from a US or European seat.
Public data thins out quickly outside the US, and for some markets nobody publishes a share at all. Those rows say "no public data" instead of carrying vendor blog numbers.
Region at a glance
| Region | Best sourced figure | First channel to check | Confidence |
|---|---|---|---|
| US | 52% OTA, 48% hotel sites and apps, online only1 | Expedia leads by revenue rank, Booking.com second7 | Medium for the split, Low for the OTA order |
| Canada | Expedia first by revenue rank7 | Expedia, then Booking.com | Low |
| Mexico | Expedia first, Booking.com second, Despegar fourth by rank7 | Expedia | Low |
| Brazil | Chains: 45% direct, 25% OTA in 20246 | Booking.com, estimated 40% to 60% of OTA reservations8 | Medium for chains, Low for the market |
| Rest of Latin America | Colombia: Booking.com first by rank7 | Booking.com | Low |
| Saudi Arabia and UAE | Booking.com 60% and 54% of OTA value39 | Booking.com, then Expedia Group | Medium |
| China | Trip.com Group about 70% of online hotel GMV10 | Trip.com Group | Medium for the GMV split |
| Japan | No hotel share; ryokan 46.9% OTA11 | Your own source mix | Low |
| Korea | No hotel share; Yanolja and Yeogi Eottae named as the leading domestic apps | Your own source mix | Low |
| Southeast Asia | OTAs around 83% of APAC bookings in D-EDGE's panel2 | Booking.com in Thailand, Indonesia, Malaysia; Agoda in the Philippines7 | Medium for the panel, Low per country |
| India | No current share; GoMMT first by vendor rank12 | GoMMT | Low |
| Australia and New Zealand | No share; direct third by revenue rank7 | Booking.com, then Expedia | Low |
Percentages for Canada (about 50%), Mexico (a modelled 55%) and Argentina (about 50%) come from vendor lists I could not re-open, so I show ranks only. Ranks are by revenue in a vendor's customer base, so they say who is first and nothing about the gap.
What is the OTA market share in the US?
OTAs hold about 52% of US online hotel bookings and hotel websites and apps about 48% (Phocuswright, 2025)1. That counts online only. Phone, walk-in and group business are outside it.
Counting all bookings, not just online ones, North American independents in Cloudbeds' base took 52.7% from OTAs in 20255, against 63.4% for its global independent base13. By revenue rank in SiteMinder's customer base, Expedia Group moved to first place in the US for the first time since 2021, and led Canada and Mexico for a second year7. Rank is not share. Nobody publishes Booking.com against Expedia as a percentage for US hotels.
Our own review data points the same way. Expedia was 35.6% of Booking.com plus Expedia reviews across our 33 US properties, mostly New York and Los Angeles4. Review share is a proxy for stays.
What is the OTA market share in Asia?
OTA market share in Asia is around 83% of bookings in D-EDGE's 2025 Asia-Pacific panel, and Agoda, at 20.9%, passed Booking.com to become the largest2. By SiteMinder's revenue rank Booking.com is still first in Thailand, Indonesia and Malaysia, and Agoda is first in the Philippines7. If Agoda is the biggest at 20.9% of all bookings, Booking.com sits under about a quarter of the OTA total. Hotels' own booking engines held 11.2%, down from 11.8% in 20222. The panel is more than 2,000 hotels across Europe and Asia, mostly independents on D-EDGE's platform: a vendor sample, not the market.
China is its own market. Trip.com Group with Qunar and Tongcheng holds around 70% of online hotel GMV, Meituan about 20%10. That is a second-hand LatePost figure, and it is GMV, not room nights.
Japan, Korea and India have no current share I can defend. Japan's ryokan association found 46.9% of ryokan guests came through OTAs in FY2024, from about 151 inns11. Ryokan are not urban hotels, and no public share exists for Rakuten Travel or Jalan. In Korea, Yanolja and Yeogi Eottae are the leading domestic apps, and no hotel share is published. Searching for the best OTA for hotels in India gets no defensible share either: the last survey I found is from 2015 and has MakeMyTrip at 25% of OTA business14.
What do hotel booking channels in the Middle East look like?
Booking.com leads both Gulf markets with public data: about 60% of Saudi Arabia's $2.3bn OTA hotel value and 54% of the UAE's $940m (VIDEC, 2024 estimates)39. VIDEC puts Saudi hotel gross booking value at $11bn, 30% online. The UAE is $2.9bn, 44% online, OTAs at $940m: Booking.com 54%, Expedia Group 21%, Agoda 18%9. Both are consultancy estimates. Qatar, Kuwait, Oman, Bahrain and Egypt: no public data.
What do Latin American booking channels look like?
Latin America has no published OTA share outside Brazil's chain survey; Booking.com holds an estimated 40% to 60% of OTA-intermediated Brazilian reservations, "according to sector estimates" quoted by Brasilturis8. Mexico and Colombia have SiteMinder ranks and no shares7. The same article reports Booking.com's Preferred Partner commission moving from 15% to 18% from 1 July 20268. Despegar and Expedia also signed a 10-year lodging deal effective January 2025, so inventory on the two is entangled15.
What a good regional read looks like
Example 1: Gulf OTA brand split, with the caveat attached

Why it works: two neighbouring markets show two different second places. Saudi Arabia has a local brand, Almosafer, at about 11% of OTA value, while the UAE split names none. Each bar is share of OTA value, and most Saudi hotel value, 70%, is offline3. Booking.com first is the shared fact in both; everything after it is local, so a Riyadh GM should check Expedia, then Agoda and Almosafer, close together.
Example 2: A hotel chain association that measured its own mix
Brazil's FOHB surveyed 27 chains and 808 hotels. Direct was 45% of 2024 sales: own website 10%, reservation centre 4%, at the property 25%, groups and events 6%. OTAs were 25%, GDS 4%, and local B2B intermediaries 26%6.
Why it works: it names sub-channels, and direct moved from 46% in 2023 to 45% in 2024, which is the kind of year-over-year line a GM can copy for their own books. It holds chains only. Independents likely sit much higher on OTAs, and the sector describes the hardest-hit hotels as having more than 70% of reservations on one channel8, a worst-case description.
Example 3: Three markets, one review proxy

Expedia is a co-leader in the US, minor in Poland and almost absent in Ukraine. The limits sit in the footnote: the sample is a prospect pipeline, and Booking.com's displayed count covers a trailing 36 months and Expedia's does not4. Martin-Fuentes and Mellinas used review counts as an estimate of Booking.com sales across 33,996 hotels, which supports the idea of a review proxy but no single ratio16.
Common failure modes
Failure 1: Averaging three different "direct" numbers

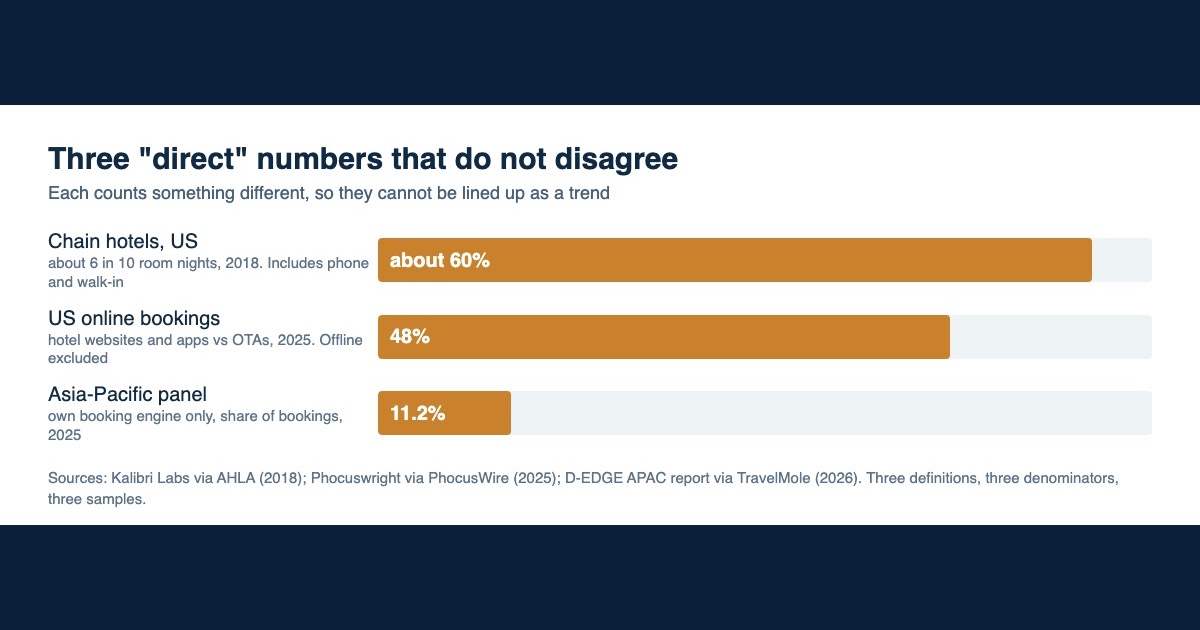
What's wrong: Kalibri's "about 6 in 10 room nights" for US chains includes phone and walk-in17. Phocuswright's 48% covers only hotel websites and apps online1. D-EDGE's 11.2% is APAC hotels' own booking engines only, from a 2,000-hotel Europe-and-Asia panel2. They measure different things, so they don't disagree. Direct bookings without breaking parity covers how to set the target once the definition is fixed.
How it hurts: a GM with 60 rooms and a 30% direct share reads Kalibri's 60% as a gap, cuts OTA allotment to chase it, and loses the room nights that were filling shoulder season. Or the GM reads 11.2% and relaxes.
Failure 2: Reading a rank as a share
What's wrong: "Expedia is number one in the US" is a revenue rank in a vendor's customer base7. It could mean 28% or 45%.
How it hurts: a Mexican boutique over-invests in Expedia promotions on a rank it cannot size. SiteMinder's ranks cover a limited set of countries, so Brazil, the Gulf, India, Japan and China have none.
Failure 3: Using a company's filing geography as a hotel-market share
What's wrong: Booking Holdings' 10-K says a reservation "made through Booking.com at a hotel in New York by a consumer in the U.S. is part of the results of the Company's businesses outside of the U.S."18 Expedia's US 59% is by point of sale, meaning the website the guest used, not the hotel's location19.
How it hurts: an analyst concludes Booking.com is irrelevant in the US. Our own data, 8,423 Booking.com reviews across 33 US properties in 12 months, says otherwise4.
Failure 4: Reading a collapse into two different metrics

What's wrong: Trustdata had Meituan at 46.2% of room nights in 201820. LatePost has it at about 20% of GMV in 202610. Different measure, eight years apart.
How it hurts: a reader sees a collapse that the data does not show, and the two numbers cannot be chained.
Step-by-step fix
- Pull 12 months of reservations by source. Export from your PMS or channel manager. Group them into Booking.com, Expedia Group, your regional leader, other OTAs, and direct. Seasonal property? Use the same months for two years.
- Count direct with one definition and write it down. Own website only, or website plus phone and walk-in. Pick one and keep it. Any outside benchmark you compare to must use the same one.
- Name your regional leader and check whether you are on it. Where a local brand is sourced: Agoda leads the Philippines by SiteMinder's revenue rank7, GoMMT (MakeMyTrip with Goibibo) leads India by STAAH's12, and Trip.com Group holds about 70% of China's online hotel GMV10. In Japan nobody publishes a share; check Rakuten Travel and Jalan in your own source mix. Traveloka and Despegar matter but rank below the global OTAs in the countries SiteMinder covers.
- Run several channels through one channel manager. Booking.com's own help says that once a room sells it is "automatically removed from all other online providers", which prevents double-bookings21.
- Sign up once for Expedia Group. See OTA channel tiers. Expedia's partner FAQ says "You do not need to sign up for all Expedia Group brands separately", and lists Hotels.com, Travelocity, Orbitz and Wotif as covered22. Agoda has its own extranet, the Partner Portal23.
- If you buy Google Hotel Ads, check your price feed. Campaigns that ran on Google's third-party rates stopped serving after 30 September 2026; to keep them running you need a direct price feed, usually through your channel manager or booking engine24. The notice covers paid Hotel Ads only.
- Recompute commission with your real rate. In Brazil, Preferred Partner went from 15% to 18% on 1 July 2026. Brasilturis's worked case: R$150,000 monthly revenue, half from Booking.com, costs about R$27,000 more a year8. R$150,000 times 12 times 50% is R$900,000, and three points of that is R$27,000. If the new rate hurts, the next moves are a higher rate on the OTA-loaded channel, dropping Preferred, or shifting allotment; Direct bookings without breaking parity covers what each does to your parity position.
- Review quarterly. A channel mix describes this year's demand and will move.
Soft recommendations
- Keep a direct rate live even if OTAs carry most of your volume: about 65% of consumers who booked directly online visited an OTA first in Cornell's 2017 study (75% in 2011)25.
- If you are above 70% on one channel, treat that as a rule of thumb for concentration risk and set your own number. It comes from how Brazilian associations described the hardest-hit hotels, not from a measured study8.
- Before telling yourself one tool covers your regional leader, open your channel manager's channel list. I did not verify connectivity for Rakuten, Jalan, Traveloka, Yanolja or MakeMyTrip across SiteMinder, Cloudbeds, Mews or RezGain.
- Ask your channel manager for source mix by month. Seasonal swings hide inside annual averages.
Self-audit checklist
Run this on your own listing without our product:
- I can name my top three channels by revenue for the last 12 months.
- I counted direct with one written definition.
- I know which regional leader applies to my market, and whether I am on it.
- My OTAs connect through a channel manager, or I have a double-booking process.
- If I buy Google Hotel Ads, they run on a direct price feed.
- I recomputed commission with my actual rates, not 15%.
- No single channel is above my own concentration limit (70% is a common rule of thumb), or I have a plan for it.
How OTALift surfaces this
We built the rate-parity report for the US first. Its one global Tier-1 list (Booking.com, Expedia, Agoda, Hotels.com, Priceline, Trip.com, Airbnb, plus your official site) needs edits outside the US.
Ignore "missing Priceline". Treat "missing Airbnb" as a product-fit question: a Mexico City or Bali boutique might reasonably list there. For an Expedia-listed hotel, "missing Hotels.com" is a list artifact, because Expedia's FAQ says one listing covers it22. Regional leaders (Rakuten, Jalan, Yanolja, Traveloka, MakeMyTrip, Meituan, Despegar) cannot satisfy the list. An undercut on one of them is filed as wholesale or bed-bank tail, so a Jakarta GM may hunt a bed-bank leak on a channel they contract directly. Country domains of the global brands (Expedia.co.uk) now match.
The dollar figure now rests on a volume estimate that reads your country. US Booking.com and Expedia reviews turn into stays through a Booking-Expedia split we derived from our own review data (labelled unbacked), with Google reviews as a cross-check. Outside Europe and the US, Google reviews alone size your guests and the report flags that fallback as unbacked. The price floor is gone. Commission is a flat 15% everywhere, and Brazil is already above it. The weekend is Friday and Saturday check-in nights everywhere. That fits the UAE's Saturday-Sunday rest week since 202226 and probably misses Saudi Arabia. The report sees only Google's panel, which is not the main search path in Korea (Naver led Korean search in one 2025 measure27) or China.
Kyoto on Rakuten and Jalan only? The Tier-1 parity read and the volume estimate cannot see your channels, though the direct-rate check on Google still works.
Related articles
- OTA channel tiers: why you don't "list on" half the channels selling your rooms
- Direct bookings without breaking parity
- Rate parity fundamentals
- Pillar: The hotel revenue flywheel
Frequently asked questions
What is the OTA market share in the US?
About 52% of online US hotel bookings go through OTAs and 48% through hotel websites and apps, per Phocuswright. That excludes phone and walk-in. North American independents sit near 53% in Cloudbeds' data15.
Is Agoda bigger than Booking.com in Asia?
In D-EDGE's 2025 panel, yes: Agoda 20.9% of bookings. By SiteMinder's revenue rank, Booking.com is still first in Thailand, Indonesia and Malaysia7. Different measures, different customers2.
What is the best OTA for hotels in India?
No current share is published. MakeMyTrip with Goibibo (GoMMT) ranked first in STAAH's 2023 vendor list. A 2015 survey had MakeMyTrip at 25% of OTA business. Check your own source mix1412.
Traveloka vs Agoda: which is bigger?
In D-EDGE's 2025 Asia-Pacific panel, Agoda is the largest OTA at 20.9% of bookings2. An earlier D-EDGE read (2023, share of online revenue) had Traveloka at 19% and Agoda at 11%28. Different metrics and samples, so do not trend them.
Are Agoda and Booking.com the same company?
Both belong to Booking Holdings. Their hotel extranets are separate: Agoda uses its own Partner Portal23. Whether one hotel contract spans both is not documented in what I read. Do not assume it.
Sources and methodology
Derived figures are my arithmetic on cited numbers: Booking.com under about a quarter of Asia-Pacific OTA volume is 20.9 divided by 83; Saudi Expedia 14% and Agoda 13% are $330m and $290m divided by $2.3bn. Confidence labels: High for a primary current figure with a clear definition, Medium for one solid source with a known caveat, Low for old, tiny, inferred or vendor-only figures. The US shares are Medium, the Gulf Medium, Brazil Medium for chains and Low for the market, and every Asia country cell is Low.
Authored by {{author}} · Reviewed by {{reviewed_by}} · Last reviewed: {{last_reviewed}}
{{author_bio}}
Footnotes
-
Phocuswright via PhocusWire, "US hotel and lodging travel market essentials," 2026. Online gross bookings 52% OTA and 48% hotel websites and apps, "expected to hold steady through 2029." https://www.phocuswire.com/news/online/us-hotel-lodging-travel-market-essentials-phocuswright-research-2026 - reported via the publisher; the page blocks automated fetches. ↩ ↩2 ↩3 ↩4 ↩5 ↩6
-
D-EDGE, APAC Hotel Distribution Report 2026, reported by TravelMole. "OTAs continue to dominate hotel distribution, accounting for around 83% of bookings"; Agoda "market share increased from 16.4% in 2022 to 20.9% in 2025"; hotel-website share 11.8% to 11.2%. https://travelmole.com/news/d-edge-booking-hotels-asia - accessed 2026-10-11. ↩ ↩2 ↩3 ↩4 ↩5 ↩6 ↩7 ↩8
-
VIDEC via Web in Travel, Saudi Arabia OTA market, 3 April 2025. $11bn hotel gross booking value, 30% online, OTAs $2.3bn, Booking.com 60%. https://www.webintravel.com/saudi-arabia-online-travel-agency-ota-market-skyrockets-ota-air-gbv-hits-us1-9-billion-hotel-climbs-to-2-3-billion/ - consultancy estimate, reported via the publisher. ↩ ↩2 ↩3 ↩4 ↩5
-
OTALift internal data - review intake aggregate across 33 US, 14 Polish and 9 Ukrainian properties (63 properties in all), trailing 12 months, read from production 2026-10-11. Expedia share of Booking.com plus Expedia reviews: US 35.6%, Poland 3.9%, Ukraine 1.5%. Booking.com's displayed count covers a trailing 36 months and was read as count divided by 3 when capped; OTA syncs mostly June to July 2026. Prospect pipeline, not a random sample, below our 500-property promotion bar. ↩ ↩2 ↩3 ↩4
-
Cloudbeds via PhocusWire, 2026 State of Independent Hotels coverage. North America OTA share rose 3.3 percentage points to 52.7% in 2025. Vendor customer base. https://www.phocuswire.com/news/distribution/hotel-distribution-ai-trends-cloudbeds-canary - reported via the publisher. ↩ ↩2 ↩3
-
FOHB and Noctua, "Apresentacao FOHB 2025," 14 September 2025. 27 chains, 808 hotels, direct 45% and indirect 55% of 2024 sales. https://fohb.com.br/wp-content/uploads/2022/10/Apresentacao-FOHB-2025-Versao-Final-14-Set-2025-VF-Para-Evento.pdf ↩ ↩2 ↩3
-
Hotel Business, "SiteMinder: domestic bookings share grows 3.2 percentage points in 2025," 4 February 2026. Expedia Group first in the US "for the first time since 2021" and leading Canada and Mexico for a second year; rank by revenue, not share. https://hotelbusiness.com/siteminder-domestic-bookings-share-grows-3-2-percentage-points-in-2025/ - accessed 2026-10-11. Country ranks: SiteMinder, Hotel Booking Trends 2025, https://www.siteminder.com/hotel-booking-trends/ ↩ ↩2 ↩3 ↩4 ↩5 ↩6 ↩7 ↩8 ↩9 ↩10 ↩11 ↩12
-
Brasilturis, "Entidades acionam CADE contra aumento de comissao da Booking.com," 24 June 2026. Preferred Partner commission from 15% to 18% from 1 July; "Segundo estimativas do setor" Booking.com holds 40% to 60% of OTA-intermediated reservations; worked R$27,000 example. Advocacy filing; Booking.com's reply is that the change is two points after 12 years. https://brasilturis.com.br/2026/06/24/entidades-acionam-cade-contra-aumento-de-comissao-da-booking-com/ - accessed 2026-10-11. ↩ ↩2 ↩3 ↩4 ↩5 ↩6
-
VIDEC via Web in Travel, UAE OTA market, 19 March 2025. $2.9bn hotel market, 44% online, OTAs $940m; Booking.com 54%, Expedia Group 21%, Agoda 18%. https://www.webintravel.com/otas-in-uae-set-for-double-digit-growth-in-both-air-and-hotel-categories/ - reported via the publisher. ↩ ↩2 ↩3
-
ChinaTravelNews citing LatePost, 2026. Trip.com Group with Qunar and Tongcheng "around 70%" of GMV in China's online hotel market; Meituan about 20%, Fliggy 5% to 7%, Douyin about 3%. https://www.chinatravelnews.com/article/190511/ - accessed 2026-10-11. Second-hand, GMV basis. ↩ ↩2 ↩3 ↩4
-
Japan Ryokan & Hotel Association, FY2024 business statistics survey. OTA 46.9% of ryokan guests, travel agencies 30.1%, own website 11.5%; about 151 respondent ryokan. https://www.ryokan.or.jp/top/news/download/698?file=1 - Japanese-language PDF. ↩ ↩2
-
STAAH via Skift, 2023. Indian channel ranking led by GoMMT (MakeMyTrip with Goibibo) for the sixth year in the vendor's property network. https://skift.com/?p=652998 - vendor rank, not a share. ↩ ↩2 ↩3
-
Cloudbeds, "2026 State of Independent Hotels," press page. OTA share of independent bookings 63.4% globally; OTA cancellation 21.8% against 10.6% for direct. https://www.cloudbeds.com/articles/2026-hotels-report-reveal/ - accessed 2026-10-11. ↩
-
Millward Brown via PhocusWire, "India's hotel receptionists take more bookings than the OTAs," 13 January 2016. July-September 2015 survey; MakeMyTrip 25%, Goibibo 19%, Booking.com 12%, Agoda 5% of OTA business. https://www.phocuswire.com/Indias-hotel-receptionists-take-more-bookings-than-the-OTAs - ten years old. ↩ ↩2
-
Skift, "Despegar gets new freedom to expand independently of Expedia's hotels in new 10-year partnership," 25 September 2024. "Most aspects of the agreement will become effective on January 1, 2025." https://skift.com/2024/09/25/despegar-gets-new-freedom-to-expand-independently-of-expedias-hotels-in-new-10-year-partnership/ - accessed 2026-10-11. ↩
-
Martin-Fuentes and Mellinas, "Hotels that most rely on Booking.com," Tourism Review, 2018. DOI 10.1108/tr-12-2017-0201. 33,996 hotels; review counts used as an indicator of estimated sales. ↩
-
Kalibri Labs, "Book Direct Campaigns 2.0," 2018. Trailing twelve months to August 2018, US direct (Brand.com, voice, property direct) about 6 in 10 room nights. https://22486350.fs1.hubspotusercontent-na1.net/hubfs/22486350/Book%20Direct%20Campaigns%202.0.pdf - chain-heavy sample, dated. ↩
-
Booking Holdings, Form 10-K for fiscal 2025. Geography is entity-based: "a reservation made through Booking.com at a hotel in New York by a consumer in the U.S. is part of the results of the Company's businesses outside of the U.S." https://www.sec.gov/Archives/edgar/data/1075531/000107553126000009/bkng-20251231.htm - accessed 2026-10-11. ↩
-
Expedia Group, Form 10-K for fiscal 2025. Revenue "based on the geographic location of our websites or points of sale"; US $8,710M of $14,733M. https://www.sec.gov/Archives/edgar/data/1324424/000132442426000008/expe-20251231.htm - accessed 2026-10-11. ↩
-
Trustdata via PhocusWire, "China's Big 5 hotel platforms have 96% of the market," 30 August 2018. Meituan Hotels 46.2% of order volume and room nights, Q2 2018. https://www.phocuswire.com/Chinas-Big-5-hotel-platforms-have-96-of-the-market - reported via the publisher. Our note that Meituan skews to lower-priced rooms is a hypothesis, not from the source. ↩
-
Booking.com Partner Hub, "What is a channel manager and how does it help with my pricing?" "once a room is sold, it will automatically be removed from all other online providers." https://partner.booking.com/en-us/help/rates-availability/extranet-calendar/how-use-channel-manager-manage-pricing-availability-and - accessed 2026-10-11 (the older help address redirects here; some fetchers get a 403). ↩
-
Expedia Group Partner Central, "Partner with Expedia Group" FAQ. "You do not need to sign up for all Expedia Group brands separately. When you partner with us, your listing will appear on some of the world's leading online travel brands, including Expedia.com, Hotels.com, Travelocity, Orbitz, Wotif and more." https://apps.expediapartnercentral.com/en_US/list - accessed 2026-10-11. ↩ ↩2
-
Agoda Partner Hub, "Understanding the YCS extranet." "Partner Portal is Agoda's extranet through which you can manage your property, including rates and availability." https://partnerhub.agoda.com/understanding-the-ycs-extranet - accessed 2026-10-11. ↩ ↩2
-
Google Hotel Center Help, "About Google third-party rates for hotel ads." Third-party rates "will be unavailable after September 30, 2026"; "To continue showing hotel ads, you must set up a direct price feed." https://support.google.com/hotelprices/answer/14310302 - accessed 2026-10-11. ↩
-
Anderson & Han (2017), "The Billboard Effect: Still Alive and Well," Cornell Hospitality Report 17(11). The 2017 study's figure is 65 percent; it restates the 2011 study: "about 75 percent of consumers who booked directly with a hotel online visited an OTA prior to purchase (compared to 65 percent in this study)". https://hdl.handle.net/1813/70982 (Cornell eCommons; the earlier sha.cornell.edu PDF address now redirects to a landing page) ↩
-
Gulf News coverage of the UAE government's December 2021 announcement of a Saturday-Sunday weekend for federal departments from 1 January 2022, https://gulfnews.com/uae/saturday-sunday-weekend-from-january-1-in-uae-four-and-half-day-working-week-1.1638864606070 - accessed 2026-10-11. Secondary source; the private sector was not covered by the directive. Saudi Arabia's private-sector rest days were not confirmed against a primary page. ↩
-
Internet Trend via NetChoice, 2025, https://techcompetition.netchoice.org/naver-doubles-googles-search-market-share-in-south-korea-in-2025/ - accessed 2026-10-11. Naver 62.86% of Korean search. Another 2025 snapshot gave Naver 47.11% and Google 45.05%, so the lead is contested. Second-hand; cited only for the Google-panel limit. ↩
-
D-EDGE, Hotel Distribution Report 2024 (2023 data). Share of online booking revenue 2023: Asia direct 32%, Traveloka 19%, Booking.com 15%, Agoda 11%; sample almost 5,000 independent hotels and small groups across Europe and Asia. https://www.d-edge.com/wp-content/uploads/2024/04/Hotel-Distribution-Report-2024-EN.pdf - read with pdftotext 2026-10-11; revenue basis, not comparable with the 2026 report. ↩